
What is it?
Coastline depletion is caused by both natural and human actions, but human activity is responsible for the aggravation of the problem. Beach erosion is rapidly occurring as a result of damming and mining, which reduce the amount of sediment that is able to be transferred from rivers to coastal areas. This occurs in combination with on- and offshore sand extraction which leads to the sinking of smaller islands as their coastlines shrink. Impacts have already been seen at as much as 0.5-1.5 meters per year for beaches in California. In combination with sea level rise (predicted at 0.26-0.55 meters by 2100), these effects may be catastrophic for coastal cities and small island nations.
What are the main causes?
Natural phenomena may be one of the causes of shoreline changes such as erosion through the action of waves and wind, the rise of sea levels or storms. Human action along the sea such as the construction of ports, land reclamation and shrimp farming, within rivers as damming and offshore activities as sand mining combined to the natural factors is responsible for exacerbating the erosion phenomena, damaging environmental ecosystems with reduction of biodiversity and reducing the social and economic opportunities which may benefit local communities and governments. Graph 1 shows the process which causes coastal erosion through both natural and human actions.
What are the consequences?
The impacts of coastline depletion are grave and may affect many people. In the case of India, for instance, coastal zone presents a huge number of varieties of species creating a rich ecosystems that include mangroves, coral reefs, sea grasses, salt marshes, mudflats, estuaries, lagoons and diverse coastal flora and fauna. Mammals, fish, corals, reptiles, turtles, seagrass meadows, seaweeds are also present in Indian rich marine ecosystems. This privileged environment is responsible for the living of a million people which work with coastal fishing full time and another 1.2 million that work in post-harvest fisheries. Graph 2 lists natural and human activities’ consequences considering the time scale of the factors.
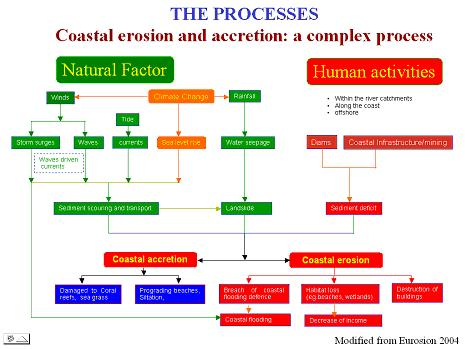
Graph 1
|
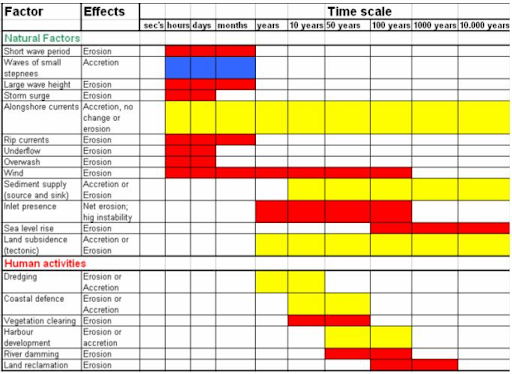
Graph 2
|
Sources:
http://www.fao.org/docrep/010/ag127e/AG127E09.htm
http://www.worldbank.org/en/news/feature/2012/10/11/protecting-indias-coastline
http://www.fao.org/docrep/010/ag127e/AG127E09.htm
http://www.worldbank.org/en/news/feature/2012/10/11/protecting-indias-coastline
